SoilGrids layers
What do the filename codes mean?
Each map in SoilGrids has three components:
- a master VRT file;
- an OVR file with overviews for swift visualisation;
- a folder with GeoTIFF tiles.
Each component name is a triplet separated by underscores: property_depthInterval_quantile. For instance, the file cfvo_5-15cm_Q05.vrt is the master file for the 5%-quantile prediction of coarse fragments in the 5cm to 15cm depth interval. Below each of the components is explained in more detail.
Properties
The table below shows the properties currently mapped with SoilGrids, their description and mapped units. All maps produced with SoilGrids store data as integer values to minimise storage space. Therefore, some properties are provided in units that are not so common in soil science. By dividing the predictions values by the values in the Conversion factor column, the user can obtain the more familiar units in the Conventional units column.
| Name | Description | Mapped Units | Conversion Factor | Conventional Units |
|---|---|---|---|---|
| bdod | Bulk density | cg/cm3 | 100 | kg/dm3 |
| cec | CEC buffered at pH7 | mmol(c)/kg | 10 | cmol(c)/kg |
| cfvo | Coarse fragments | cm3/dm3 (vol‰) | 10 | cm3/100cm3 (vol%) |
| clay | Clay | g/kg | 10 | g/100g (%) |
| nitrogen | Nitrogen | cg/kg | 100 | g/kg |
| ocd | Organic carbon density | hg/m3 | 10 | kg/m3 |
| ocs | Organic carbon stocks | t/ha | 10 | kg/m2 |
| soc | Soil organic carbon | dg/kg | 10 | g/kg |
| phh2o | pH water | pH x 10 | 10 | - |
| sand | Sand | g/kg | 10 | g/100g (%) |
| silt | Silt | g/kg | 10 | g/100g (%) |
| wv0010 | Volumetric Water Content at 10kPa | 10-3 cm3cm-3 (0.1 v% or 1 mm/m) | 10 | 10−2 cm3 cm−3 (%) |
| wv1500 | Volumetric Water Content at 1500kPa | 10-3 cm3cm-3 (0.1 v% or 1 mm/m) | 10 | 10−2 cm3 cm−3 (%) |
| wv003 | Volumetric Water Content at 33kPa | 10-3 cm3cm-3 (0.1 v% or 1 mm/m) | 10 | 10−2 cm3 cm−3 (%) |
Depth intervals
SoilGrids predictions are made for the six standard depth intervals specified in the GlobalSoilMap IUSS working group and its specifications:
| Interval I | Interval II | Interval II | Interval IV | Interval V | Interval VI | |
|---|---|---|---|---|---|---|
| Top depth (cm) | 0 | 5 | 15 | 30 | 60 | 100 |
| Bottom depth (cm) | 5 | 15 | 30 | 60 | 100 | 200 |
Prediction quantiles
SoilGrids maps have associated uncertainties as any product derived from a modelling approach. The prediction uncertainty is quantified by probability distributions. For each property and each standard depth interval this distribution is characterised by four parameters:
- Q0.05 - 5% quantile;
- Q0.50 - median of the distribution;
- mean - mean of the distribution;
- Q0.95 - 95% quantile.
Uncertainty layer
The additional uncertainty layer displayed at soilgrids.org is the ratio between the inter-quantile range (90% prediction interval width) and the median : (Q0.95-Q0.05)/Q0.50. The values are multiplied by 10 in order to have integers and reduce the size of the datasets.
How were the spatial predictions generated?
SoilGrids uses state-of-the-art statistical methods for digital soil mapping, relying exclusively on open source tools. The models are tailored per soil property and fitted using documented models. For each property, a global model is calibrated using a spatially stratified 10-fold cross-validation procedure. The model produces values at each map location (cell) and standard depth. The prediction distribution is captured in four different maps reporting its 5%, 50% and 95% quantiles, and the mean.
The ‘mean’ and ‘median (0.5 quantile)’ may both be used as predictions of the soil property for a given cell. The mean represents the ‘expected value’ and provides an unbiased prediction of the soil property. The median yields that value for which there is a 50% probability that the true soil property value is greater and a 50% probability that the true value is smaller. For symmetric distributions the mean and median are identical, while the mean is greater than the median for distributions that are skewed to the right (such as soil organic carbon concentration).
The 0.05 and 0.95 quantiles present the lower and upper boundaries of a 90% prediction interval and may be used as a measure of prediction uncertainty following the GlobalSoilMap IUSS working group and its specifications. This interval presents a value range that contains the true soil property value for each cell (which one would measure from a soil sample taken at the centre of the cell) with 90% probability.
Quantiles of the distribution were computed with Quantile Regression Forests (Meinhausen, 2006) as implemented in the ranger package in R. The mean was computed using the default random forests algorithm.
How were the legends generated?
Legends were generated using the natural Breaks algorithm. The legends are available for download in QGIS3 format.
Which soil properties are predicted by SoilGrids?
SoilGrids contains predictions and associated prediction uncertainties, following the GlobalSoilMap IUSS working group and its specifications, for basic soil properties: pH (in water), texture fractions, coarse fragments, bulk density, total nitrogen, organic carbon concentration, cation exchange capacity and volumetric water content.
Silt size is between 0.002 and 0.050 mm (USDA classification) and between 0.002 and 0.063 mm (ISO and FAO classification). These differences can be registered in WoSIS, but often the required information is absent in the source databases. Presently, no difference is made between the two for the mapping (i.e., reported figures are used independently from the classification used at the source) to avoid the exclusion of a large number of observations.
SoilGrids provides also predictions for ‘complex’ soil properties such as organic carbon densities at the six standard depths and organic carbon stocks for topsoil (0-30cm) and subsoil (30-100cm, in development). The list of targeted soil properties will be gradually extended, based on user requests and the availability of soil observations.
Which soil properties will be available in the future?
The list of targeted soil properties will be gradually extended, based on user requests and the availability of soil observations. For example we are developing new predictions for texture classes and soil depth. We are also working on maps for subsoil carbon stocks (30-100cm and 100-200cm).
How were SOC stock maps generated?
SOC stock maps (0 to 30 cm) were generated by first calculating the carbon stocks at sampling locations and then calibrating a model to obtain the global map. To calculate carbon stocks, first we modelled the carbon density from SOC concentration, bulk density and proportion of coarse fragments for each observation. Then, the weighted sum of the carbon densities for the observations between 0 and 30 cm was calculated. Finally, a Quantile Random Forest model was calibrated and used for the global map.
The organic layers on top of mineral soils were removed from the calculations and models. The total global carbon stocks obtained with version 2 (599 Pg of carbon for 0 to 30cm) are more in line with other global estimates (see for example: Jackson et al, 2017, Table 2 and Scharlemann et al, 2014).
Are there differences between the soil organic carbon stocks in the latest and former versions of SoilGrids?
There are differences in the calculated stocks between the two versions of SoilGrids. These differences are due to different modelling approaches and different input data.
The SOC stocks in SoilGrids version 2.0 were obtained with a calculate first interpolate later approach. See this page (How were SOC stock maps generated (Section 5)) for more details. The SOC stocks in SoilGrids version 2017 were obtained with a interpolate first calculate later approach, where the stocks were calculated from the maps of the input properties Hengl et al, 2017.
If I calculate SOC stock from SOC density why does it not equal the SOC stock layer? As described above, the SOC stock is first calculated from the carbon density at the sampling location, then the model is calibrated to produce the global map. The carbon density map itself was not used in the calculation of the carbon stock, only the input data points.
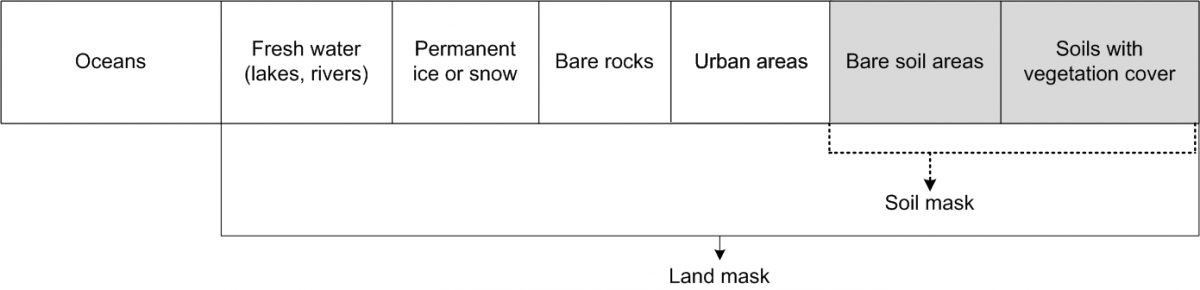
Which soil mask was used?
The soil mask map provides an approximation of global coverage of soils, i.e. where soil occurs. For the current SoilGrids release, the global soil mask map was derived from the latest ESA land cover map, with the classes Urban (code 190), inland water (code 210), glacier (code 220) and bare surface (code 200) masked out. Predictions have been produced only for soils with vegetation cover and soils without vegetation cover. No estimate is provided for permanent ice areas since they are subject to extreme climatic conditions. The areas that have been masked out are often under-represented in soil surveys, making it difficult to fit a reliable statistical model.
How accurate are the SoilGrids layers?
The accuracy of SoilGrids layers is still limited and the variation explained by the models is between 30% and 70%. This is due to many factors:
Limitations on input data spatial distribution and representativeness for different soil types and ecoregions. Certain regions have a very low density of soil profile observations. This is especially relevant for Central Asia, the Artic regions, coastal areas and deserts. We are continuously working on increasing the number and spatial coverage of input data.
Covariates: the covariates used span many soil forming factors. However, we are still missing reliable fine resolution proxies for some important factors, in particular parent material. We are working on extending the set of covariates to improve prediction accuracy.
Modelling choices: Random Forest is a reliable and efficient modelling choice. Other approaches may provide more accurate results at the expenses of heavier computations.
In the current release, we quantified prediction uncertainty as 5th and 95th percentiles. These prediction intervals provide spatially explicit information about the accuracy of the maps.
The issue of accuracy is especially relevant for carbon stocks as these are the results of a complex workflow where numerous sources of uncertainties are combined. For example, the current version has lower than expected values for some organic soils. This is being addressed and investigated.
SoilGrids works on a “rolling release” system; we are providing updates and fixes as soon as these become available. Soon web pages with cross-validation results for all soil properties will be made available.
Last updated on 2026-02-24